Aerial mapping of
the University of Wisconsin Eau Claire.
Introduction:
This week we resume our efforts to map the University of
Wisconsin Eau Claire (UWEC) campus in Eau Claire, Wisconsin. We will be using a
Lumix digital camera mounted below a large helium filled balloon to take aerial
photographs of the area from a height of about 400 feet. This aerial rig will
be guided around the campus collecting high resolution images at a minimal cost
to be used in the creation of a large scale map of the UWEC campus.
Methods:
This week the class was again broken up into several groups
today in order to complete activities related to deployment of the mapping
equipment. The group’s activities included; transport of the large helium tank
from storage to the garage where the balloon would be filled and filling the
balloon, measuring several hundred feet of tether line, assembly of the camera
rig , gathering of ground control points and photographing and videotaping of
the activities.
A group of students gathered ground control points from the
UWEC lower campus to be used in georeferencing of the photographs (figure 1). They used
varied equipment to gather the data points including; Nomad, Juno and Topcon
units. The data points were loaded into Arcmap as a feature dataset (figure 2).
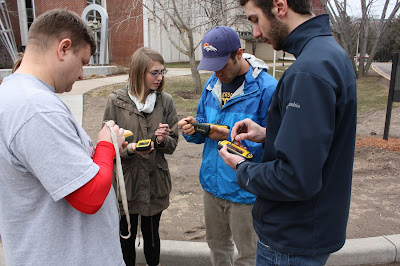 |
| Fig.1. Students and Martin preparing to gather ground control points. They used varied equipment to gather the data points including; Nomad, Juno and Topcon units. |
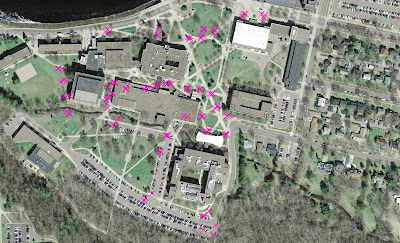 |
| Fig.2. The data point gathered by students were loaded into Arcmap as a feature class to be used to georeference our aerial images. |
The cylinder of helium was successfully transported from
storage on the second floor, down one floor and around the Phillips Science
Building to the garage without incident (figure 3) where it was used to fill a large
balloon. The balloon is the source of elevation for the mapping rig. It is
controlled from the ground by operators tethered to the balloon and camera using
several hundred feet of cord.
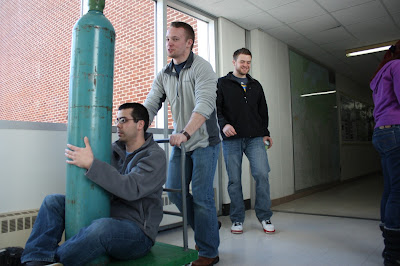 |
| Fig.3. Transportation of the helium from storage to the shed where it was used to fill the balloon. |
Approximately 700 feet of tether cord were measured out and
marked in 50 foot sections (figure 4) so we could track the amount of cord being used and
the approximate height of the balloon rig. This cord was then fastened to the
base of the balloon.
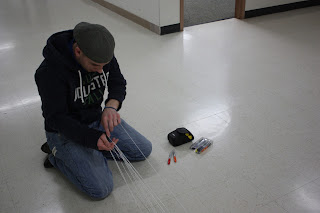 |
| Fig.4. Students measured 700 feet of cord used to guide the mapping rig in 50 foot sections. |
Our previous experience taught us that the foam box (figure 5) was not a very stable platform to photograph from so we went back to the bottle design we originally planned for, but using a fan I found these were also very unstable in the wind and got tossed and spun a lot. To stabilize the rig I used an old aluminum arrow that I had (the aluminum is strong and lightweight) and fixed a vertical wing or blade to one end. Then I cut the arrow shaft to the bottle length and wrapped the ends good with electrical tape so they would not damage the balloon. When this blade was added to the bottle (figure 6), it was sufficiently stabilized. Both the amount of spin and the amount of roll/bounce were reduced greatly. When it was time to assemble the rig we were wary of how well the camera was mounted inside the bottle and were afraid it might come loose. It had been suggested to try to mount the camera directly to the bottom of the bottle but this, I believe, would have also been unstable due to the movement of the balloon. To securely fasten the camera and isolate it from the roll of the balloon we decided to mount the camera directly to the arrow shaft and loose the bottle. The bottles main function was to help protect the camera in the event of a collision with the ground or another object so now we had to be more careful with the rig. We mounted the camera using cable ties and tape and made sure we could set the controls and operate it with it mounted. We used cordage tied to both the front and back ends of the arrow shaft to suspend the rig from the balloon (figure 7). By keeping the mounting points of the cord as far apart as possible we hoped to make the rig more stable. We found the center of balance in the rig and tied an overhand knot in the cord giving us a loop to mount the rig from, and used a karabiner to fasten the rig to the balloon.
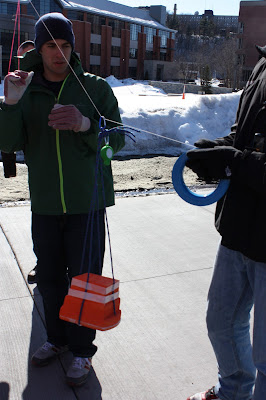 |
| Fig.5. The original foam box used during our first attemt at mapping was not a stable platform so it was not used. |
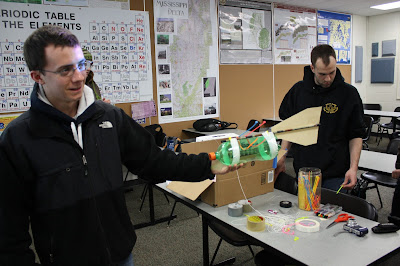 |
| Fig.6. The bottle rig was stabilized using a fin and attached using an arrow shaft. |
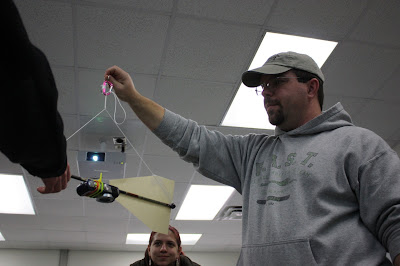 |
| Fig.7. We eventually scrapped the bottle rig due to concerns over how well the camera was fastened into it. The result was the fin with the camera attached directly to the shaft. |
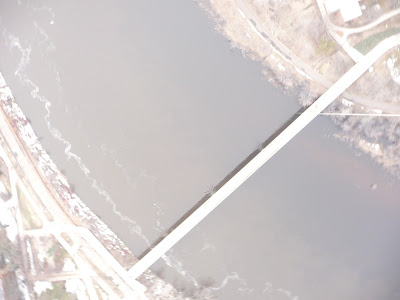
After the rig was fully assembled we brought it to the UWEC campus mall area. This is a large, very open area great for the initial launch. We set the camera to take continuous images, double checked the rig and proceeded to launch the rig. We let out cord to get to an elevation of 400 feet above the ground, during this time we lost count of how much cord had been released and had to estimate that we were at least to 400 feet. We guided the balloon rig across the campus mall, around the Davies building and east across the parking lot. Then we came back and around the Phillips building and out to the street. We proceeded north through lower campus to the foot bridge and across the Chippewa River and on to Water street. We then guided the balloon west on Water Street to 2nd avenue then crossed south into the Haas parking lot. After crossing the lot we were forced to bring the rig in due to overhead obstructions (trees). At this point we found that the rig was approximately 500 feet in the air. We walked the rig back to the south end of the foot bridge where we redeployed it. Now we guided it east on Garfield avenue to the steps that climb to upper campus. The balloon rig was guided up the steps and to the south/west through upper campus. Near the upper campus recreation area the balloon was again retrieved (figure 8). After retrieving the rig we found the camera battery almost dead and almost 5000 images on the SD card. The images were loaded into the computer system for later use.
To process the pictures I first had to go through them to find suitable pictures for mosaicing. I looked for photos which were well focused, and not washed out (figures 9,10). Then I chose photos that covered the area of interest and overlapped each other by at least 50 – 60%. The reason for this is the pictures are best in the center 1/3 and become more distorted as you move to the edges. By overlapping the images we can maintain as much of the centers of the images as possible. Then in Arcmap we open a new file geodatabase and open new map document. I set the document workspace environments to the new geodatabase, and opened the georeferencing toolbar. We split the class into six groups, each group was to georeferenced a specific portion of campus to minimize the amount of time each student would spend referencing the photos. My groups area was the around the Haas Fine Arts Center, north of the Chippewa River on lower campus. To georeference the photos we have to start with some sort of ground data to reference them to. We did not have any ground control points collected in the area we were working on so I used two other sources. The first was a .tif image of the entire campus area, pre-construction (the campus has undergone a lot of new construction over the last couple of years), the second was a layer file that was built from a CAD file containing the true locations of all the buildings on campus. I used both of these but to make the building locations more usable I used a polygon to vertices tool to create vertices of the buildings (fugure11). While referencing the photos I could now snap right to a building corner as a ground control point (GCP). For each photo I began by adding the photo to the workspace and zooming to the photo layer, selecting the photo in the georeferencing toolbar, and selecting the GCP tool from the toolbar. The GCP’s selected had to be points that were easily identifiable and had not changed over time, the building corners, streetlights and lampposts worked well for these. I then selected a prominent feature such as a building corner as a GCP and zoomed to the building layer where I could locate the corresponding corner in the layer and select it. After I made two GCP’s the photo would be loosely aligned in the image, from here I would make several more choices for good GCP’s to at least 12 points. After reaching 12 points on a photo I changed the method from a first order polynomial to a second order polynomial, helping to smooth out the transition between images. As I added GCP’s to the images I would keep watch on the RMS error. This is root mean square, and is a measure of how accurately the photos are aligned. Ideally I would look for the RMS to be at or below 0.05, but for many of the images it was between 0.05 and 1.00.
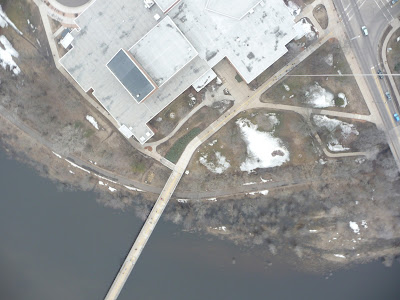 |
| Fig.10. This photo has much better contrast in comparison to the photo in figure 9. |
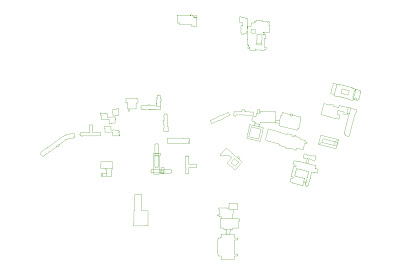 |
| Fig.11. This is a jpeg of the UWEC building vertices created from the CAD file. |
While referencing the photos we had to try to eliminate the cord that the rig was attached to (figure 12). This cord was visible in many of the images. To overcome this I layered the photos beginning in the south/east corner of the area and moving to the west. After reaching the farthest west images I returned to the eastern edge slightly north of the first images and worked to the west again. This process layered the images in such a fashion that the string was removed from all but the most western and northern images (figure 13).
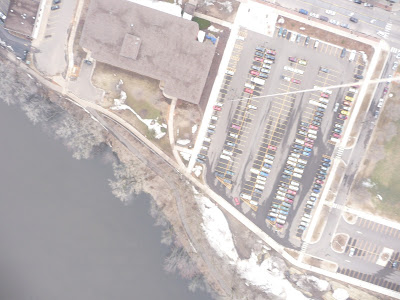 |
| Fig.12. The cord used to guide the balloon rig is clearly visible in the upper right portion of this photo. While georeferencing the images care was used to eliminate as much of this as possible. |
After completing the area north of the foot bridge I was
not happy with how some of the buildings appeared. The roads and other hard
ground lines appeared well but in the process the roof of the buildings would
become severely distorted. To overcome this I found images with the entire roof
in it, I cropped the image to just the roof then referenced it into the image.
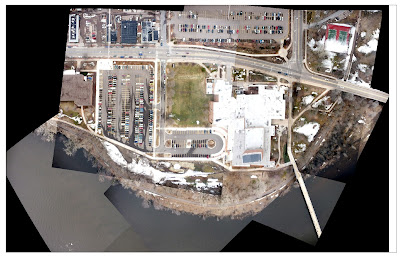
Now I could run the mosaic to new raster tool creating a
single raster image, and save the image as a .tif in my folder then import the
image into my geodatabase (figure 14). After gathering images for the rest of campus and
projecting them the same there was a new challenge. The .tif images come with a
large area of no data surrounding the image, we have to remove this to mosaic
the individual areas of campus together. In the workspace I used create new feature
class to create a polygon of the .tif image, then began an editing session to
build the polygon around the image and save the edits before quitting the
editing session. Then I was able to run the extract by mask tool to crop the
image back to the usable portion. After doing this for each of the areas of
campus I was able to georeference the areas just as I had the single photos. There
were a few spots that needed additional work by adding a few new photos. After referencing
all of campus together I ran the mosaic to new raster tool again to get a
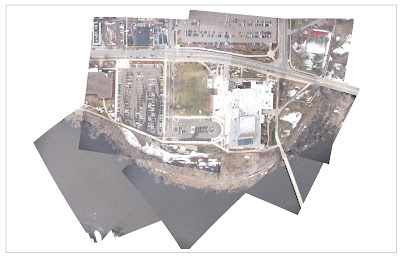
single complete image of UWEC campus (figure 15).
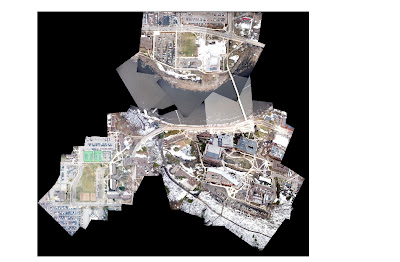 |
| Fig.15. This .tif image shows the area of the UWEC campus that was photographed. This image is the result of cropping each of the individual areas, georeferencing them and mosaicing them together. |
Discussion:
Overall this attempt at balloon mapping went much smoother
than the first. The wind speeds were very low allowing us to get the balloon
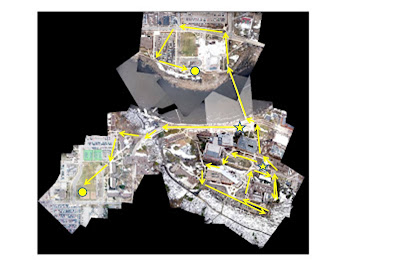
high enough to sufficiently cover the area (figure 16). The images were much improved with
the combination of camera rig and lower wind speeds (figure 17). The blade behind the
camera kept the rig facing into the wind which minimized the amount of side to
side movement in the rig. Without the bottle we could shorten the arrow shaft
of the blade to only be slightly longer than the camera and blade, this would
eliminate the rig catching up against the tether cord when the rig is
deployed. There also may have been some discrepancy
in the height at which we took the images; after we brought the rig in the
first time we found that we had overshot our height by at least 100 feet, I am
not sure we got back to the same height after we redeployed the rig at the
south side of the foot bridge. There is some variation in cell size among the
images. Most of the images on lower campus have a cell size between 0.044 and
0.05 meters; however, on Garfield avenue heading east (after redeployment) the
image cell size increases to one meter and then on upper campus the cell size
is about 0.07 meters. I am not sure what is causing this variation, there may be some variation in rig height. There is also an area east of the nursing building that does not fit
together well I believe this is due to cell sizes and bad coverage in the area.
Many, not all, of the images in this area do not have much overlap so the edge
distortion is very high resulting in poor image matching. It has also been
suggested that we make another attempt with a camera that has higher resolution
and to stop midway and swap out batteries and memory cards.
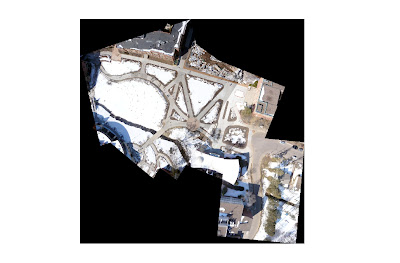 |
| Fig.16. The .tif image from our first attempt to balloon map. There was a great deal of camera bounce and swing due to the wind. Also compare the photo coverage with the photo coverage in figure 17. |
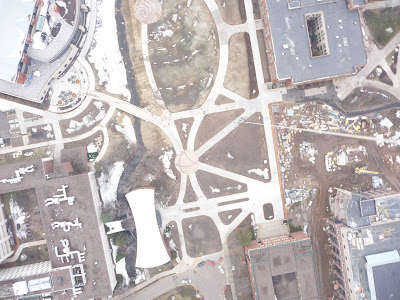 |
| Fig.17. Due to better conditions outside we were able to get a much greater altitude with our balloon rig. A single image covers the area of at least two images from the first attempt. |
Conclusion:
Although we were quite successful I would like to see
another attempt. This has been a trial and error exercise with us learning as
we go. We are getting the bugs worked out and are beginning to see some quality
to the work. I also fully believe this could work well for large scale, high
resolution mapping given the area is free from overhead obstructions. A more
comprehensive and accurate set of ground control points would also aid in the
process, but we are learning as we go and making continuous improvements.
No comments:
Post a Comment