Construction of a helium balloon and camera rig to do small scale
remote sensing.
Introduction:
This week we spent preparing for two future projects. Much
of the time involved research and development of weights and measures, camera
rigs, parachute testing and testing of a tracking beacon. One of the projects
involves small scale aerial mapping using a digital camera rigged beneath a
helium filled balloon floating at about 500 feet above the ground. The balloon
will be tethered to a person on the ground guiding it around the area of
interest. This may be a good way to obtain high resolution images of a small
area at a very reasonable cost. Many remote sensed images available are 2 meter
by 2 meter resolution; depending on the camera used and the height obtained by
the rig, our images could be down to centimeters of resolution. The second project
nicknamed HABL (high altitude balloon launch), includes building another camera
rig, again to be fastened beneath a helium filled balloon. This rig will be
allowed to fly as high as it is able, it will not be tethered to the ground. As
it rises it will record video of its journey. After HABL reaches its maximum
altitude, it will deploy a parachute to slow its descent. This rig will be
fitted with a tracking beacon for retrieval. We worked in several groups on
different aspects of the projects: HABL, parachute testing, weights, camera housings and a tracking beacon. My groups work follows.
Methods:
The first objective was to test several digital cameras to
see if they could shoot pictures in a continuous mode and identify the process
to get the camera into that mode. The camera I studied was a Panasonic Lumix DMC-F28.
The process involves several steps as
follows: 1, remove the lens cover; 2, turn the camera on; 3, press and hold the
multi-frame/garbage button for about 1 second; 4, use the arrow keypad to
select unlimited; 5, press the set/menu button to confirm the selection. After which
the camera is ready to use.
The second objective was to modify the camera to be able to
shoot in continuous mode without having a person to hold down the shutter
button. We accomplished this by wrapping a heavy rubber band around the
camera over the shutter button and placed a small piece of cable tie on the
shutter button under the rubber band; a small piece of paper folded up, a pencil
eraser or any other small object that that will hold down the shutter button as well. This
allows the camera to function while floating hundreds of feet in the air.
 |
| Fig. 1. We wrapped a rubber band around the camera, over the shutter button and placed a piece of a cable tie under the band to keep the button pressed. Now the camera will be able to take continuous images while suspended from the balloon. |
The third objective was to build the rig that supports the
camera beneath the balloon. We had two groups working on two different designs.
One group followed instructions obtained from an online source (http://archive.publiclaboratory.org/download/Grassroots_Mapping_English_2_0.pdf)
which describes a rig that works using the top half of a soda bottle; however, after
some research my partner and I were not happy with how the rig seemed to spin a
lot, as evidenced by the directionality of the online photos. We decided to attempt
to build a more aerodynamic rig to reduce the amount of movement in the camera
and rig by turning the bottle on its side.
Tools and equipment used to build the rig included scissors,
scalpel, cordage, 2-2 liter soda bottles, a large rubberband, a sharpie marker,
metric rulers and 6-10 plastic cable ties (figure 2). We began by measuring the height of
the camera, most of the cameras we measured were about 6 centimeters (cm) tall and
the width of the lens, ours was about 4cm, we will need this later. Next, we
took the large rubberband and stretched it around one of the soda bottles, end
to end, across the cap and around the bottom (figure 3). We checked to see that the bottle
was bisected into two equal halves lengthwise. We then used the marker to mark
the bottle down both sides using the rubberband as a guide (figure 4) after which we removed
the rubberband. Next, we measured up from the bottom of the bottle on one of
the lines and marked out 5 and 20 cm. At both of these points we measured
around the bottle, out from the line, in both directions 5 cm then connected
the four points giving us a 10cm by 15cm square. Using the scalpel (figure 6) we removed
this section of the bottle, this will be where we insert the camera and our
viewport (figure 7).
 |
| Fig. 2. These are the tools and equipment needed; 2 2 liter soda bottles, 2 rubber bands (one short heavy, one long), sharpie marker, cable ties, twine, a scalpel and a pair of scissors(not pictured). |
 |
| Fig. 3. Use the long rubber band to bisect the bottle into two equal halves lengthwise. |
 |
| Fig. 4. use the sharpie to mark the center line of the bottle, on both sides, following the rubber band. |
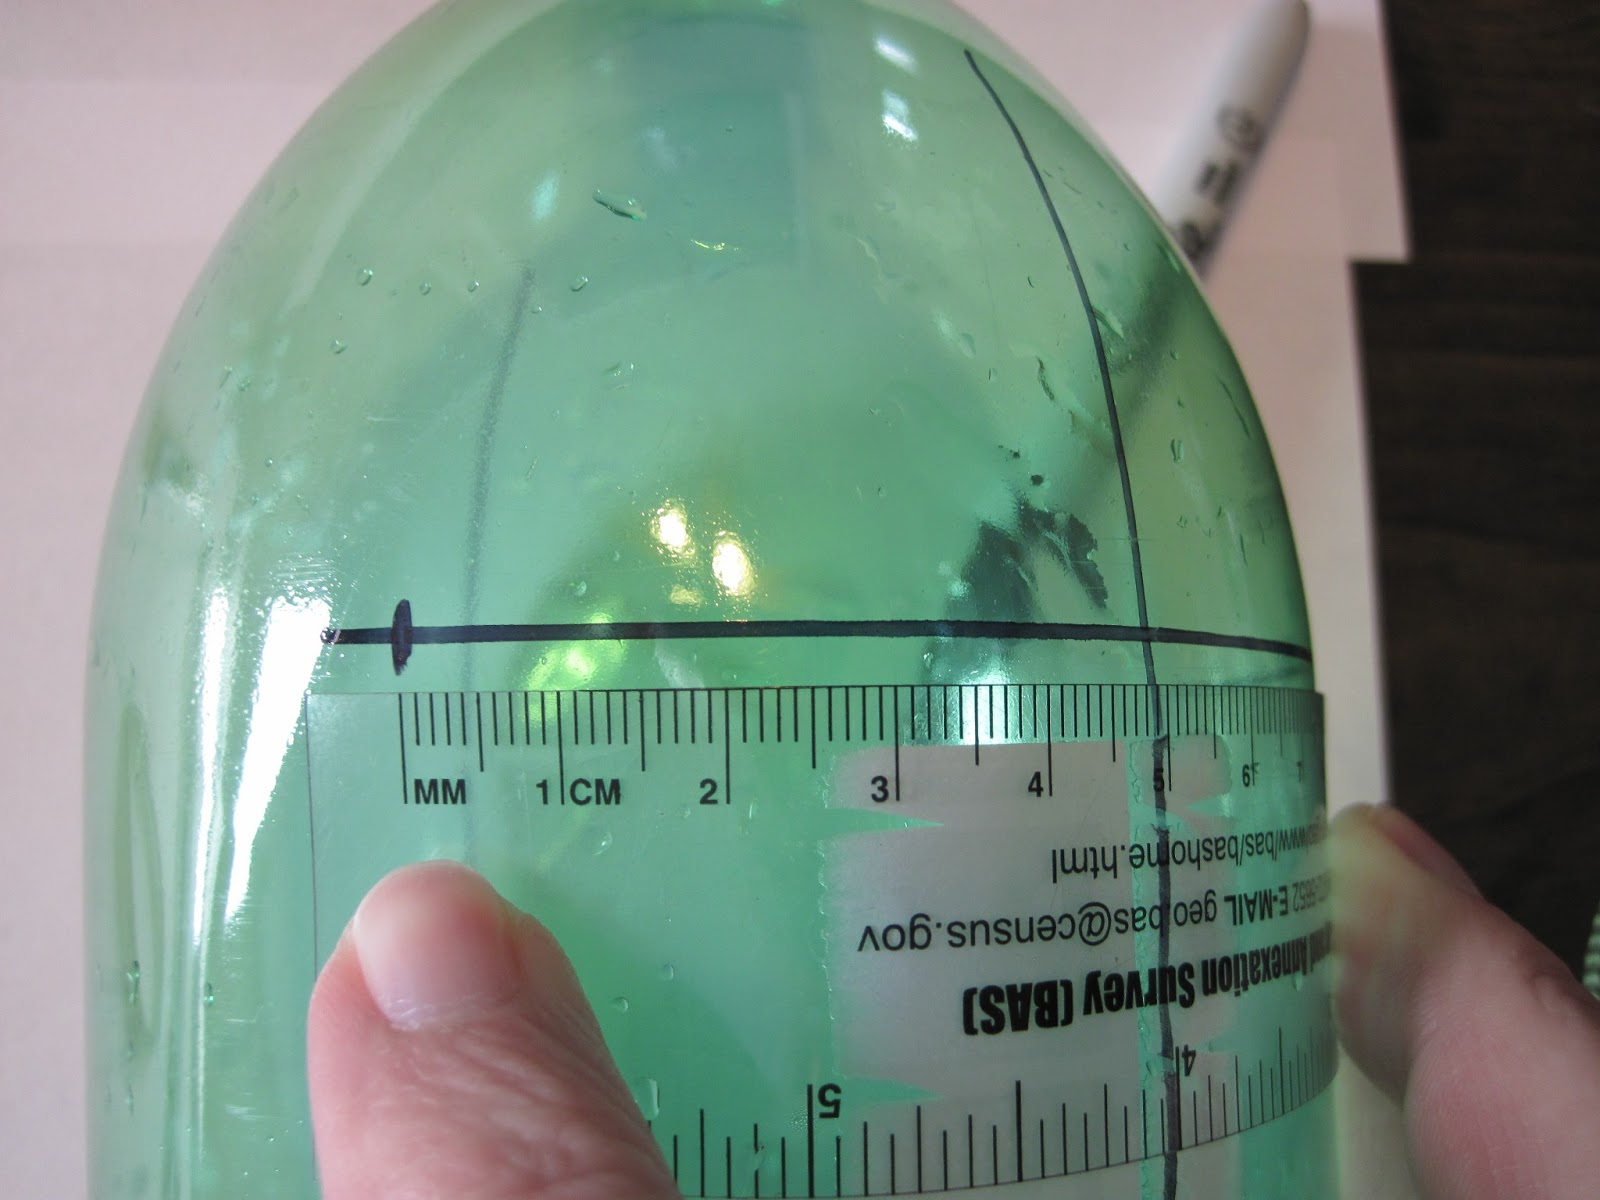 |
| Fig. 5. On one side of the bottle, measure from the bottom and mark at 5 cm and at 20 cm. Then extend these lines around the sides of the bottle 5 cm in either direction. |
 |
| Fig. 6. Connect the corners of the 10 cm by 15 cm rectangle and use the blade to carefully cut on the lines. |
 |
| Fig. 7. Remove the panel, now we have access to the inside of the bottle and we have our view port. |
Then we moved to the other side of the bottle. Here we
measure up from the bottom of the bottle on the other line and mark at 4 cm,
6 cm, 12.5 cm and 20 cm (figure 8). At the 4 cm mark we measured out in both directions from
the center line and made a mark at 1.5 cm (figure 9). These two points should be 3 cm apart
and 4 cm from the bottom of the bottle. At these two points we made vertical (the
same direction as the length of the bottle) ¼ inch incisions in the bottle (figure 10). The
same procedure was used at the 6 cm mark. These holes will be used to fasten the wing and
the suspension string to the body. Then we measured and marked both up and down
the center line from the 12.5 cm mark, half the distance of the width of the
camera lens 2 cm (4 cm total) (figure 11). This part may vary depending on the camera, but
the lens at 12.5 cm with the camera weight forward balances fairly well, not precise.
At these points we measured out from the
center line in both directions 3 cm (figure 12). We now had four points that measured 4 cm by 6 cm;
we made ¼ inch vertical incisions at all four points. These will be used to
mount the camera inside the housing. At the 20 cm center line mark we again measure
out away from the center line 1.5 cm and made ¼ inch vertical incisions (figure 13). These will
support the forward suspension cord.
 |
| Fig. 8. We measured from the bottom on the opposite side of the bottle using the center line as a guide and marked at 4 cm, 6 cm, 12.5 cm and 20 cm. |
 |
| Fig. 9. At the 4 cm and 6 cm marks we measured out in both directions from the center line and made a marks at 1.5 cm. These four points should be 3 cm apart and 4 cm and 6 cm from the bottom of the bottle. |
 |
| Fig. 10. At the points we made vertical (the same direction as the length of the bottle) ¼ inch incisions in the bottle. |
 |
| Fig. 11. We measured and marked 2 cm from the 12.5 cm mark, the total of 4 cm is equal to the width of the camera lens. |
 |
| Fig. 12. We measured out from the center line out in both directions 3 cm. At the four corner marks we made ¼ inch vertical incisions. |
 |
| Fig. 13. At the 20 cm center line mark we measured out from the center line 1.5 cm and made ¼ inch vertical incisions. |
To aid with stabilization in the moving air we designed a
wing. For the wing we cut a 10 cm by 20 cm section from a second soda bottle (figure 14). The
piece was removed near the center of the bottle to reduce distortion due to
curvature of the bottle. The 10 cm dimension is along the long axis of the
bottle and the 20 cm dimension runs around the bottle. We measured the wing and
marked it at 10 cm drawing a line that divided it into two equal halves. We
measured on the line from one side and marked it, drawing a line at at 2 cm (figure 15). We used these
two points to line the wing up over the 4 cm and 6 cm marks on the bottle, the long
side of the wing should hang off the back of the rig. We lined up the points
with the concave side of the wing against the bottle (figure 16). After the points were aligned we marked the ¼ inch
incisions on the wing, now we could make corresponding incisions in the wing.
 |
| Fig. 14. We cut a 10 cm by 20 cm section from a second soda bottle. |
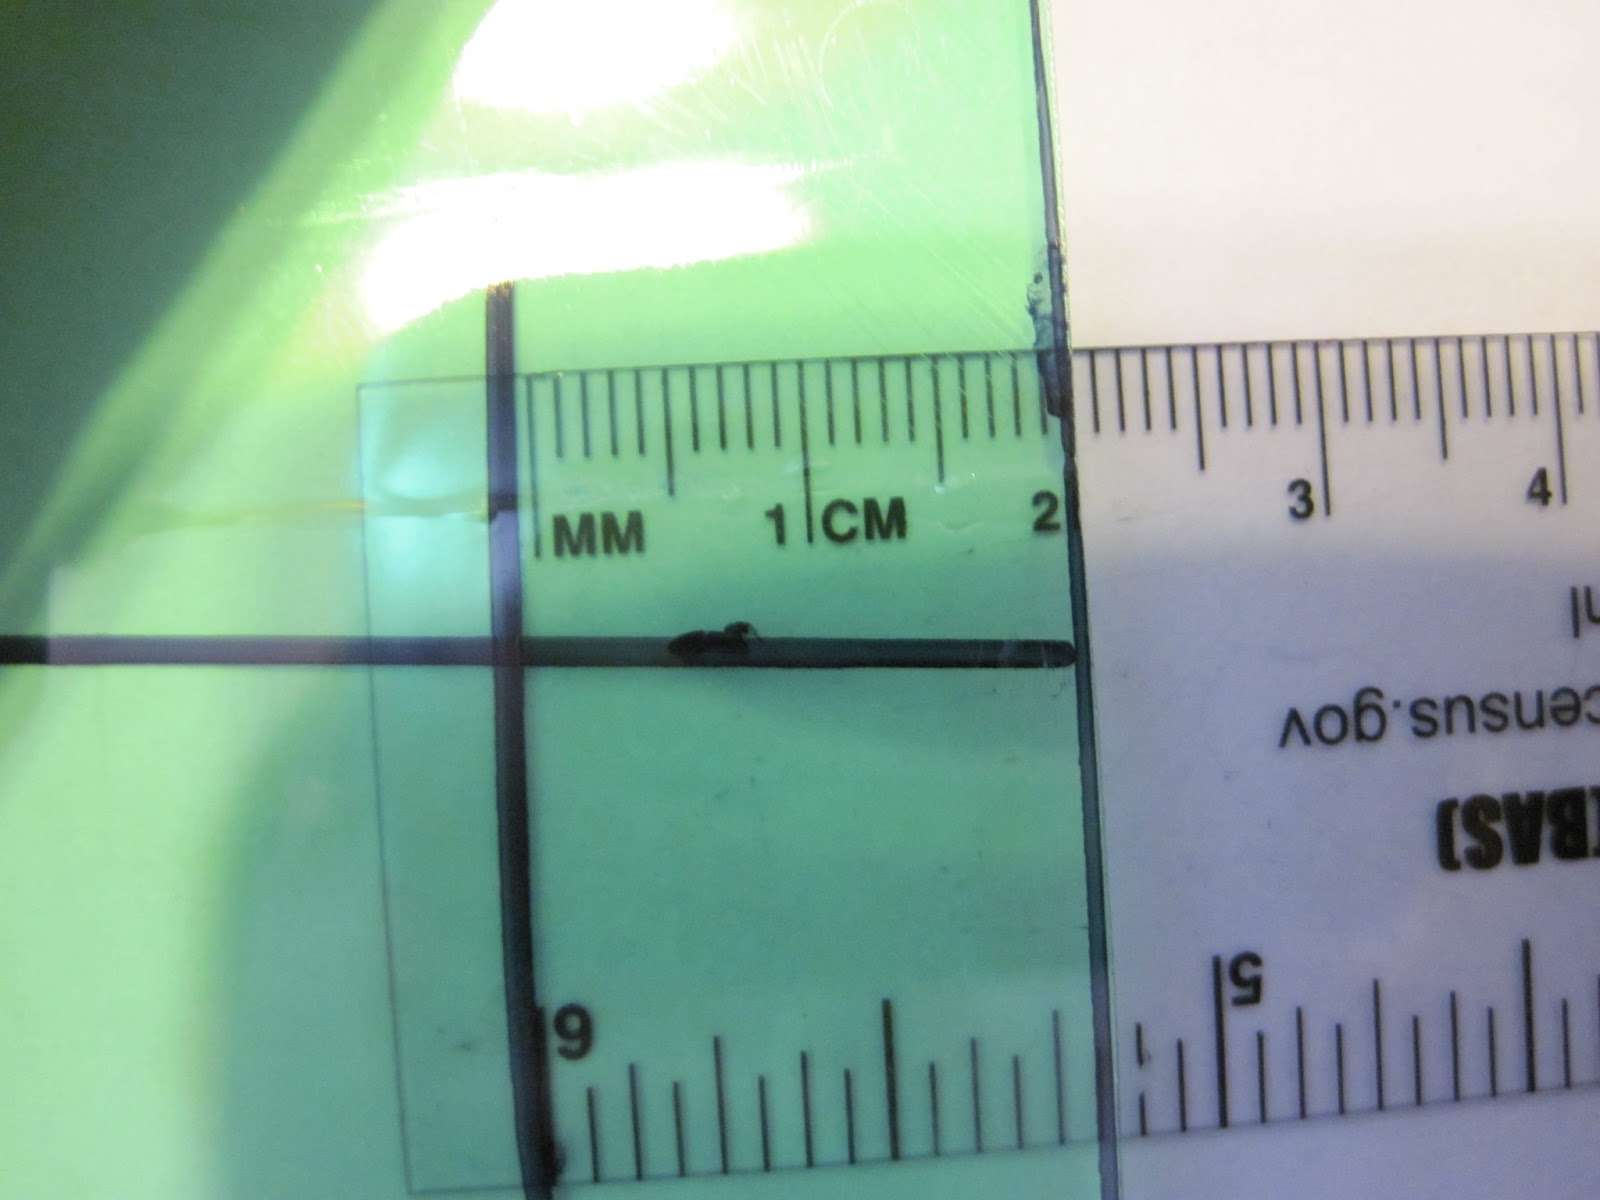 |
| Fig. 15. We measured the wing and marked it at 10 cm drawing a line that divided it into two equal halves ( horizontal line). Then we measured in from the edge on one side and marked it drawing a line at 2 cm . |
 |
| Fig. 16. We used the lines on the wing to reference it against the four slits in the bottom end of the housing. Now we were able to make incisions in the wing that corresponded to the housing. |
We used 90 cm of cordage to suspend the rig. I tied an
overhand knot (figure 17) in each end of the cord (figure 18), this is a good knot that will not slip
and it provides a loop to secure the rig to.
 |
| Fig. 17. I folded about 8 cm of the end of the cord back on itself then made a simple overhand knot. |
 |
| Fig. 18. We tied knots in both ends of the cord to secure it to each end of the rig. |
To assemble the rig we ran two cable ties from the inside of
the bottle out the left side 4 cm and 6 cm incisions. The wing should now line up
convex side against the bottle and the long side of the wing should be to the
back of the rig. We ran the cable ties up through the corresponding holes in
the left side of the wing (figure 19) and the tie at 6 cm through one end of the suspension cord (figure 20),
and then we ran both ties back through the holes in the right side of the wing
and into the bottle. After we had both ends back inside we were able to zip
them together tightly and cut the excess off (figure 21). At the center four incisions we ran a cable tie into each of the
left side slots from the outside to the inside then back out the right side
incisions (figure 22). At the 20 cm incisions we again ran a cable tie from the inside of the bottle out through the left side incision and through the other end of the suspension cord and back into the bottle through the right side incision (figure 23). We pulled the cable tight and removed the excess.After the camera was set to take photos it was placed into these
ties with the lens towards the back of the rig, the ties were tightened and we
were ready. There was need for some minor adjustment to ensure the rig was
level reducing any roll or pitch that may occur during operation.
 |
| Fig. 19. We ran cable ties from the inside of the housing out through two of the back holes of the housing. |
 |
| Fig. 20. The foremost of the two back ties was also fed through one end loop of the suspension cord. |
 |
| Fig. 21. Both ties were securely tightened and the excess was removed with a scissors. |
 |
| Fig. 22. We inserted two cable ties into the left side of the housings center holes and then they were then fed back out but not fastened, these will support the camera.\ |
 |
| Fig. 23. Similar to the back holes, we fed a tie out from inside the housing and through the other end of the suspension cord. The tie was fed back into the housing and secured. |
Our rig may work well or it may fail completely, testing it
with some air such as a fan might be a good idea. If it fails it would be
better it fail in our hands than a fall of several hundred feet. During construction
Martin thought we may have trouble because the internet plans suggest the lens
of the camera be about 2cm from the bottom of the housing, ours is much deeper. I believe this has
to do with the field of view of the camera. After testing our rig it
performs well with no interference from the housing evident within the photos.
Another of the differences that I believe allow our rig to be successful are
our camera is secured directly to the housing which minimizes movement; the
other rig has the camera suspended from cordage inside the housing. Weight is
of importance during these tests (figure 24), we need to know how much each part weighs
also the whole rig including the balloon so we get the correct amount of helium in
the balloon to achieve lift. Our rig weighed about 239.69 grams when weighed
with the Cannon camera. After completion of our rig we have affectionately named it the Hindenburg.
| Balloon Mapping Weight Chart | |
| Item | Weight |
| Balloon (Orange) | 315.5 g |
| Balloon (Red) | 322.25 g |
| Black rubber ring (~1 inch) | 8.25 g |
| Camera (Biggest, black) | 392.17 g |
| Carabineer (blue with key ring) | 4.79 g |
| Carabineer (silver with loop) | 26.71 g |
| Coke Bottle (2 liters, empty, whole with cap) | 50.86 g |
| Coke Bottle (Top, Label "1") | 18.6 g |
| Coke Bottle (Top, Label "2") | 12.5 g |
| Handwarmers (2 in package) | 54.37 g |
| Jif Peanut Butter (No cap, empty, whole) | 48.6 g |
| Memory card (16 gb) | 2.16 g |
| Memory card (32 gb) | 2 g |
| Minno Thermo with lid and rope | 75.85 g |
| Mt. Dew (2 liters, empty, whole with cap) | 52.08 g |
| Orange Camera (No memory card) | 185.77 g |
| Parachute (blue and orange) | 144.7 g |
| Pink Rope (1 meter) | 1.15 g |
| Rainex Bottle (Empty, whole with cap) | 141.36 g |
| Rope (150 ft.) | 416.51 g |
| Rubber band (black, midrange) | 2.8 g |
| Rubber band (blue, thin, medium) | 2.37 g |
| Rubber band (Extra small, orange) | 1.14 g |
| Rubber band (long, tan, thin) | 4.7 g |
| Rubber band (long, white, wide) | 14.4 g |
| Rubber band (short, white, wide) | 5.69 g |
| Rubber band (thin, white) | 3.5 g |
| Silver Camera (No memory card) | 187.5 g |
| Styrofoam (Pink, 1.5 by 19 by 17.5 in) | 200.3 g |
| Yellow Cord with buckle | 106.5 g |
| Zip Tie (Black) | 1.5 g |
| Zip Tie (long, multicolored) | 1.16 g |
| Zip Tie (Short, multicolored) | .31 g |
| 7 Packs of Handwarmers | 379.86 g |
| Cut Styrofoam+Minno Thermo | 102.12 g |
| Green Bottle (With cannon, grey "Hindenburg") | 239.69 g |
| Total Pay Load for High Altitude | 944.34 g = Approx. 2.08 lbs |
Fig. 24. Weights, measured in grams, for all possible parts being
applied to the camera rigs. Also included is the approximate total
weight of the Hindenburg.
This report only contains the details of the rig building
there is more to the overall structure including how the rig is fastened to the
balloon and how the balloon is handled.
We have obtained a kit from the website mentioned previously. the kit contains a large balloon, ties, a ring, carabiner and the rope to tether and guide the balloon. A large ring is placed over the nozzle of the balloon before filling. The balloon is then filled with helium, due to size differences we have to manufacture a nozzle to fit from the helium tank to the balloon nozzle. After filling the balloon the nozzle is folded back on itself with the ring secured in the fold. above the ring the nozzle is secured with cable ties. From the ring the tether rope will be fastened using a carabiner. There will also be another carabiner with a large fishing type of swivel suspended from the ring, the camera rig will be connected to the swivel. the carabiners make attaching and releasing the rig much easier. The camera rig will be suspended from the swivel which will allow it to move free of the balloon. The balloon tether is controlled by a person on the ground who will manipulate it around the area
being mapped. Much of this may be adjusted as we have not fully worked out the flight details.
Conclusion:
Throughout this period we were able to think freely and try
new ideas or improvements to existing ideas. . It is always better to be
proactive rather than reactive; if you are in a situation where you have to
react you are likely undoing a lot of damage that has already been done or are
redoing a lot of work that was not completed correctly the first time. Trying
to think ahead and figure out what might be needed with a project or what could
possibly go wrong when you are in the field is essential. Proper preparation
may help you look ahead and stop some problems from occurring before they
happen you, saving you time in the end


