Sunday, April 21, 2013

Balloon Mapping I


Field testing the mapping and HABL camera rigs.

Introduction:

Previously we explored varying methods of suspending a camera beneath a helium filled balloon to do small scale aerial mapping. This week we tested two of the aerial rigs over the University of Wisconsin Eau Claire’s (UWEC) lower campus. One of the rigs tested was for use in the high altitude balloon launch (HABL). The other rig was similarly constructed but used for aerial mapping.

Methods:

The class was broken up into several groups today in order to complete several activities related to a successful deployment of the rigs. The group’s activities included; transport of the large helium tank from storage to the garage where the balloon would be filled, filling the balloon, measuring several hundred feet of tether line, assembly of the camera rig and photographing and videotaping of the activities.
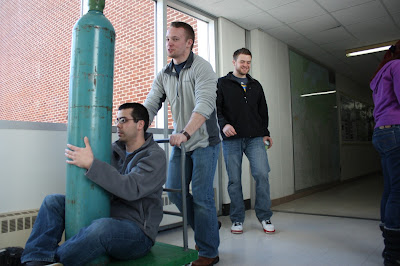
The cylinder of helium was successfully transported (figure 1) from storage on the second floor, down one floor and around the Phillips Science Building to the garage without incident where it was used to fill a large balloon (figure 2). The balloon is the source of lift for the mapping rig.

Fig.1. The large helium tank had to be transported from storage to the work shed
where the helium was used to fill the balloon for mapping.
Fig.2. Filling the balloon was a team effort due in part to the size of the balloon.
A piece of rubber hose was used to pipe the helium from the tank into the balloon.

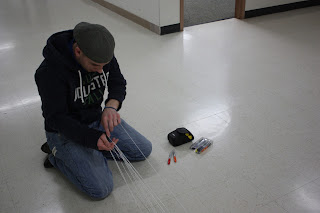
Approximately 500 feet of tether cord were measured out and marked in 50 foot sections so we could track the amount of cord being used and the approximate height of the balloon rig (figures 3,4,5).

Fig.3. 50, one foot floor tiles were used to measure out the tether cord. 

Fig.4. The cord was measured out to 450 feet and marked every 50 feet.

Fig.5. We marked the cord every 50 feet in order to track the elevation of the
balloon rig when it was used.

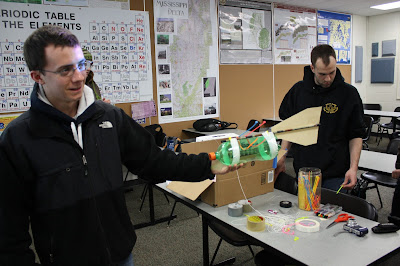
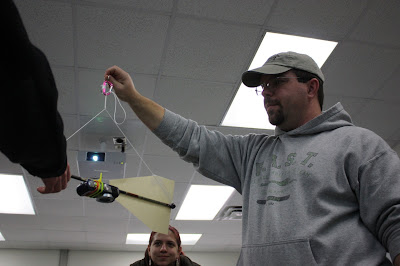
The camera rig used for the HABL project was modified to use for mapping due to the ease of use and overall stability of the rig comared to the bottle rigs (figure 6). This rig was simply a styrofoam bait box turned upside down with a hole in the lid for a camera viewport (figures 7,8). Then heavy cords were attached from the bottom around each of the four sides to above the rig where they were tied in a knot. The camera was fastened onto the inside of the lid with the lens in the viewport (figure 9). The camera used for mapping was set to take continuous pictures while deployed, the HABL camera was set to take video.

Fig.6. The original bottle rigs built for mapping were not used due to thier
instability in the air.

Fig.7. A rig very similar to the HABL rig was used for mapping.
The design of this rig was very simple and easy to use.

Fig.8. The HABL rig was tested using the balloon rig.
The testing was done to help eliminate any issues that
might arise in the actual launch. 

Fig.9. Both the HABL and the mapping rig were set up with the camera fastened
to the inside of the box lid with the lens looking through a viewport  in the lid.
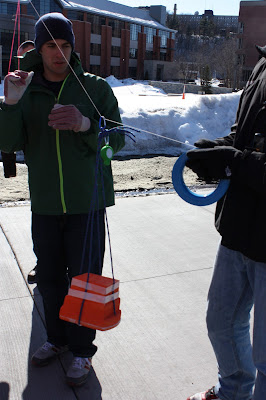
After all of the individual parts were functional we assembled the rig. The tether cord was attached to the balloon using a large ring and a carabiner (figure10). From this point the mapping camera rig was also hung. We began in the campus mall area; this is an open space without overhead obstructions. We started the camera and slowly released four hundred feet of line out (figure 11). The rig was guided around the campus mall area (figure 12) and brought back in; this was just to test the rig. We then attached the HABL rig to the balloon and again released four hundred feet of line in the campus mall area. After guiding the rig around the mall we took it north towards the foot bridge and across the Chippewa River. After crossing the river we concluded our tests, prematurely (figure 13).  

Fig.10. After the balloon was filled the tether cord was attached using a
karabiner, the camera rig was hung similarly below the balloon. 
Fig.11. As students released the cord allowing the balloon to rise they were
watching for the marks on the cord which told them how much line
had been released.
Fig.12. As the balloon rig was guided around the
campus mall area these lamp posts were nearly the
only obstruction, there were also some trees near
buildings.  

Fig.13. This image was shot shortly before the tether cord broke allowing the
balloon to float off into the wild blue yonder and the camera rig to crash not
so delicately into the Chippewa River ending our test run. Note the position of
the balloon in relation to the bridge, the wind had a great effect on our success. 

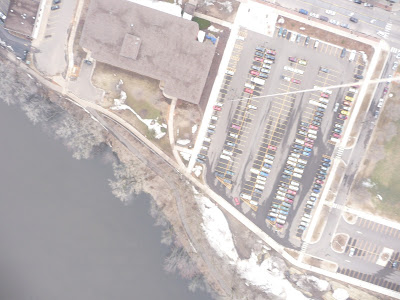
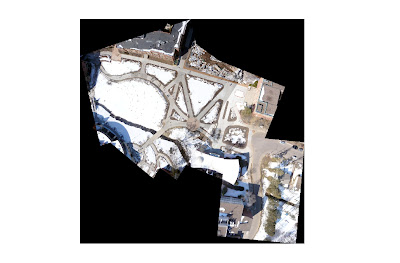
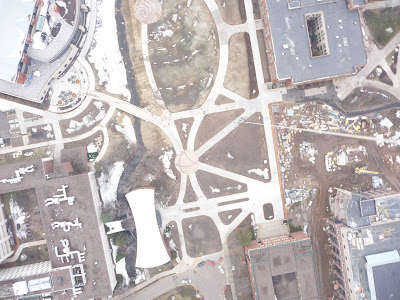
The images we obtained from the mapping rig (figure 14) were sorted through and the best were used to create a map of the campus mall area. To make this map we used a TIFF image of UWEC campus as a base layer and georeferenced each new J-peg image in arcmap. After each image was georeferenced we used the mosaic to new raster tool to create a single image (figure 15).

Fig.14. This image was shot from our balloon mapping rig! Not all of the images
turned out so well, many were out of focus and not pointed directly at the ground. 
Fig.15. several of the better images were used
to make a mosaic of the area. This .tif image
is the result of the mosaic process with our
aerial images.
 
Discussion:

This was a busy afternoon with cooperation needed buy all involved, that said it was moderately successful. We were testing the equipment in less than desirable conditions and the wind was an issue (figure16). During the mapping test the wind caused the balloon to bounce and move only slightly; however, the camera rig was buffeted severely causing several images of the horizon and not the ground. The wind also caused the rig not to reach its full height, even though we had four hundred feet of line out the rig was only about 150 feet off of the ground. The test with the HABL rig was similar right to the end. After crossing the river we experienced a significant equipment failure. Something in the area of the balloon either the tether cord or the balloon itself failed. After the failure the balloon floated of into the approaching dusk and the camera rig plummeted into the Chippewa River. The design of the rig saved it, the camera was waterproof and more importantly the foam bait box floats on water. After landing on the water it floated near the edge and was retrieved as it passed near the foot bridge using a long stick and a lucky grab (figure 17).   

Fig.16. The effects of the wind are apparent in this image, the rig is pointing
somewhere off into the sunset.

Fig.17. Professor Joe Hupy is hiking back up from the rocky shore of
the Chippewa River with his prize from a skilled grab with a 12 foot stick.
The design of the rig, using the foam bait box with its inherent buoyancy,
 certainly aided us in the recovery of our rig from the river
Conclusion:

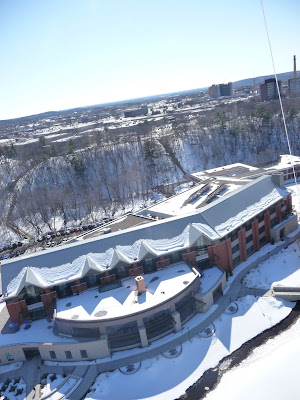
Although we encountered some difficulties we learned some valuable information. Do not attempt in high or even moderate winds. Even in light winds the HABL construction may not be the best for the mapping rig. It is greatly affected by the winds causing it to spin and be tossed around very erratically. It was also interesting to see the first images from such a simple rig. Also, being a bit of a photography buff this may be an interesting method of taking photographs (figures 18,19).  

Fig.18. The windy conditions led to some interesting photos.
This image is looking north across Schofield Hall and up the
Chippewa River.
Fig.19. Due to the wind we were able to obtain probably the
most unique image of the new Davies Student Center on
the UWEC campus.

Balloon Mapping II


Aerial mapping of the University of Wisconsin Eau Claire.

Introduction:

This week we resume our efforts to map the University of Wisconsin Eau Claire (UWEC) campus in Eau Claire, Wisconsin. We will be using a Lumix digital camera mounted below a large helium filled balloon to take aerial photographs of the area from a height of about 400 feet. This aerial rig will be guided around the campus collecting high resolution images at a minimal cost to be used in the creation of a large scale map of the UWEC campus.

Methods:

This week the class was again broken up into several groups today in order to complete activities related to deployment of the mapping equipment. The group’s activities included; transport of the large helium tank from storage to the garage where the balloon would be filled and filling the balloon, measuring several hundred feet of tether line, assembly of the camera rig , gathering of ground control points and photographing and videotaping of the activities.

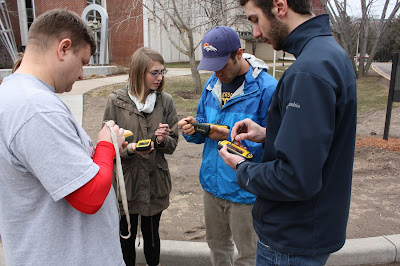
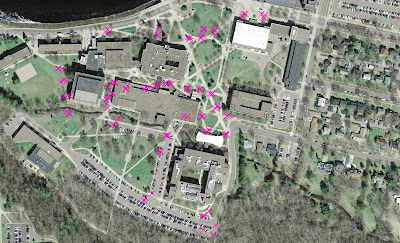
A group of students gathered ground control points from the UWEC lower campus to be used in georeferencing of the photographs (figure 1). They used varied equipment to gather the data points including; Nomad, Juno and Topcon units. The data points were loaded into Arcmap as a feature dataset (figure 2).

Fig.1. Students and Martin preparing to gather ground control points.
They used varied equipment to gather the data points
including; Nomad, Juno and Topcon units.
 

Fig.2. The data point gathered by students were loaded into Arcmap as a
feature class to be used to georeference our aerial images.
The cylinder of helium was successfully transported from storage on the second floor, down one floor and around the Phillips Science Building to the garage without incident (figure 3) where it was used to fill a large balloon. The balloon is the source of elevation for the mapping rig. It is controlled from the ground by operators tethered to the balloon and camera using several hundred feet of cord.

Fig.3. Transportation of the helium from storage to the shed where it was
used to fill the balloon.
Approximately 700 feet of tether cord were measured out and marked in 50 foot sections (figure 4) so we could track the amount of cord being used and the approximate height of the balloon rig. This cord was then fastened to the base of the balloon.
Fig.4. Students measured 700 feet of cord used to guide
the mapping rig  in 50 foot sections.

Our previous experience taught us that the foam box (figure 5) was not a very stable platform to photograph from so we went back to the bottle design we originally planned for, but using a fan I found these were also very unstable in the wind and got tossed and spun a lot. To stabilize the rig I used an old aluminum arrow that I had (the aluminum is strong and lightweight) and fixed a vertical wing or blade to one end. Then I cut the arrow shaft to the bottle length and wrapped the ends good with electrical tape so they would not damage the balloon. When this blade was added to the bottle (figure 6), it was sufficiently stabilized. Both the amount of spin and the amount of roll/bounce were reduced greatly. When it was time to assemble the rig we were wary of how well the camera was mounted inside the bottle and were afraid it might come loose. It had been suggested to try to mount the camera directly to the bottom of the bottle but this, I believe, would have also been unstable due to the movement of the balloon. To securely fasten the camera and isolate it from the roll of the balloon we decided to mount the camera directly to the arrow shaft and loose the bottle. The bottles main function was to help protect the camera in the event of a collision with the ground or another object so now we had to be more careful with the rig. We mounted the camera using cable ties and tape and made sure we could set the controls and operate it with it mounted. We used cordage tied to both the front and back ends of the arrow shaft to suspend the rig from the balloon (figure 7). By keeping the mounting points of the cord as far apart as possible we hoped to make the rig more stable. We found the center of balance in the rig and tied an overhand knot in the cord giving us a loop to mount the rig from, and used a karabiner to fasten the rig to the balloon.

Fig.5. The original foam box used during our first attemt
at mapping was not a stable platform so it was not used.

Fig.6. The bottle rig was stabilized using a fin and attached using an arrow shaft.

Fig.7. We eventually scrapped the bottle rig due to concerns
over how well the camera was fastened into it. The result was
the fin with the camera attached directly to the shaft.

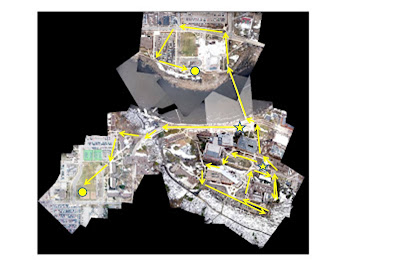
After the rig was fully assembled we brought it to the UWEC campus mall area. This is a large, very open area great for the initial launch. We set the camera to take continuous images, double checked the rig and proceeded to launch the rig. We let out cord to get to an elevation of 400 feet above the ground, during this time we lost count of how much cord had been released and had to estimate that we were at least to 400 feet. We guided the balloon rig across the campus mall, around the Davies building and east across the parking lot. Then we came back and around the Phillips building and out to the street. We proceeded north through lower campus to the foot bridge and across the Chippewa River and on to Water street. We then guided the balloon west on Water Street to 2nd avenue then crossed south into the Haas parking lot. After crossing the lot we were forced to bring the rig in due to overhead obstructions (trees). At this point we found that the rig was approximately 500 feet in the air. We walked the rig back to the south end of the foot bridge where we redeployed it. Now we guided it east on Garfield avenue to the steps that climb to upper campus. The balloon rig was guided up the steps and to the south/west through upper campus. Near the upper campus recreation area the balloon was again retrieved (figure 8). After retrieving the rig we found the camera battery almost dead and almost 5000 images on the SD card. The images were loaded into the computer system for later use.
Fig.8. These are the routes we used to guide the mapping rig
around campus, the arrows are indicating the direction of travel.
The stars indicate areas of rig deployment, while the
 circles indicate the area where the rig was brought down.

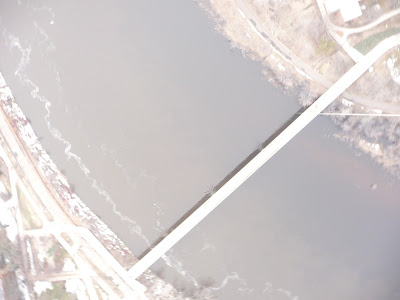
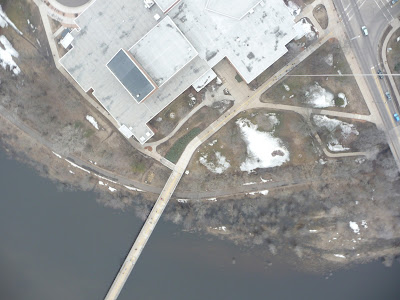
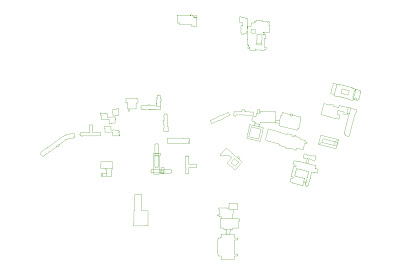
To process the pictures I first had to go through them to find suitable pictures for mosaicing. I looked for photos which were well focused, and not washed out (figures 9,10). Then I chose photos that covered the area of interest and overlapped each other by at least 50 – 60%. The reason for this is the pictures are best in the center 1/3 and become more distorted as you move to the edges. By overlapping the images we can maintain as much of the centers of the images as possible. Then in Arcmap we open a new file geodatabase and open new map document. I set the document workspace environments to the new geodatabase, and opened the georeferencing toolbar. We split the class into six groups, each group was to georeferenced a specific portion of campus to minimize the amount of time each student would spend referencing the photos. My groups area was the around the Haas Fine Arts Center, north of the Chippewa River on lower campus. To georeference the photos we have to start with some sort of ground data to reference them to. We did not have any ground control points collected in the area we were working on so I used two other sources. The first was a .tif image of the entire campus area, pre-construction (the campus has undergone a lot of new construction over the last couple of years), the second was a layer file that was built from a CAD file containing the true locations of all the buildings on campus. I used both of these but to make the building locations more usable I used a polygon to vertices tool to create vertices of the buildings (fugure11). While referencing the photos I could now snap right to a building corner as a ground control point (GCP). For each photo I began by adding the photo to the workspace and zooming to the photo layer, selecting the photo in the georeferencing toolbar, and selecting the GCP tool from the toolbar. The GCP’s selected had to be points that were easily identifiable and had not changed over time, the building corners, streetlights and lampposts worked well for these.      I then selected a prominent feature such as a building corner as a GCP and zoomed to the building layer where I could locate the corresponding corner in the layer and select it. After I made two GCP’s the photo would be loosely aligned in the image, from here I would make several more choices for good GCP’s to at least 12 points. After reaching 12 points on a photo I changed the method from a first order polynomial to a second order polynomial, helping to smooth out the transition between images. As I added GCP’s to the images I would keep watch on the RMS error. This is root mean square, and is a measure of how accurately the photos are aligned. Ideally I would look for the RMS to be at or below 0.05, but for many of the images it was between 0.05 and 1.00.

Fig.9. Some of the images were washed out. This was due to the image being
mainly over the water which has low reflectance, the low reflectance causes
 the camera shutter to remain open for an extended period of time.
Fig.10. This photo has much better contrast in comparison to the photo in
figure 9. 

Fig.11. This is a jpeg of the UWEC building vertices created from
the CAD file.

While referencing the photos we had to try to eliminate the cord that the rig was attached to (figure 12). This cord was visible in many of the images. To overcome this I layered the photos beginning in the south/east corner of the area and moving to the west. After reaching the farthest west images I returned to the eastern edge slightly north of the first images and worked to the west again. This process layered the images in such a fashion that the string was removed from all but the most western and northern images (figure 13).

Fig.12. The cord used to guide the balloon rig is clearly visible in the upper right
portion of this photo. While georeferencing the images care was used to
eliminate as much of this as possible.
Fig.13. The area north of the foot bridge on lower UWEC campus. Many of
the cord images have been covered by layering; however, near the top and
the right there were no more images to layer leaving the cord visible. 

After completing the area north of the foot bridge I was not happy with how some of the buildings appeared. The roads and other hard ground lines appeared well but in the process the roof of the buildings would become severely distorted. To overcome this I found images with the entire roof in it, I cropped the image to just the roof then referenced it into the image.

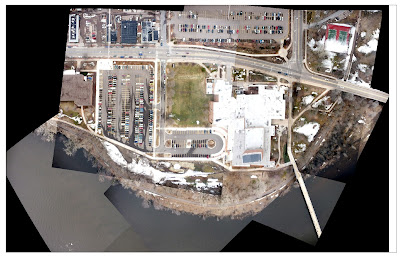
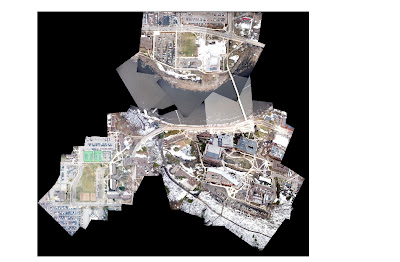
Now I could run the mosaic to new raster tool creating a single raster image, and save the image as a .tif in my folder then import the image into my geodatabase (figure 14). After gathering images for the rest of campus and projecting them the same there was a new challenge. The .tif images come with a large area of no data surrounding the image, we have to remove this to mosaic the individual areas of campus together. In the workspace I used create new feature class to create a polygon of the .tif image, then began an editing session to build the polygon around the image and save the edits before quitting the editing session. Then I was able to run the extract by mask tool to crop the image back to the usable portion. After doing this for each of the areas of campus I was able to georeference the areas just as I had the single photos. There were a few spots that needed additional work by adding a few new photos. After referencing all of campus together I ran the mosaic to new raster tool again to get a single complete image of UWEC campus (figure 15).

Fig.14. This is the .tif image of the mosaiced area north of the foot bridge on
UWEC lower campus. To mosaic this image with the rest of campus I created
 a new feature class polygon and edited it to the outline of the image within
the .tif, then cropped the image using the polygon and the extract by mask tool.
Fig.15. This .tif image shows the area of the UWEC campus that
was photographed. This image is the result of cropping
each of the individual areas, georeferencing them and
mosaicing them together. 
Discussion:

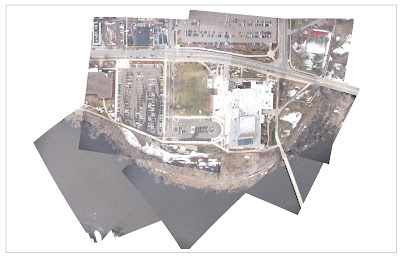
Overall this attempt at balloon mapping went much smoother than the first. The wind speeds were very low allowing us to get the balloon high enough to sufficiently cover the area (figure 16). The images were much improved with the combination of camera rig and lower wind speeds (figure 17). The blade behind the camera kept the rig facing into the wind which minimized the amount of side to side movement in the rig. Without the bottle we could shorten the arrow shaft of the blade to only be slightly longer than the camera and blade, this would eliminate the rig catching up against the tether cord when the rig is deployed.  There also may have been some discrepancy in the height at which we took the images; after we brought the rig in the first time we found that we had overshot our height by at least 100 feet, I am not sure we got back to the same height after we redeployed the rig at the south side of the foot bridge. There is some variation in cell size among the images. Most of the images on lower campus have a cell size between 0.044 and 0.05 meters; however, on Garfield avenue heading east (after redeployment) the image cell size increases to one meter and then on upper campus the cell size is about 0.07 meters. I am not sure what is causing this variation, there may be some variation in rig height. There is also an area east of the nursing building that does not fit together well I believe this is due to cell sizes and bad coverage in the area. Many, not all, of the images in this area do not have much overlap so the edge distortion is very high resulting in poor image matching. It has also been suggested that we make another attempt with a camera that has higher resolution and to stop midway and swap out batteries and memory cards.
Fig.16. The .tif image from our first attempt to balloon
map. There was a great deal of camera bounce and
swing due to the wind. Also compare the photo coverage
with the photo coverage in figure 17.

Fig.17. Due to better conditions outside we were able to get a much
greater altitude with our balloon rig. A single image covers the area
of at least two images from the first attempt.


Conclusion:

Although we were quite successful I would like to see another attempt. This has been a trial and error exercise with us learning as we go. We are getting the bugs worked out and are beginning to see some quality to the work. I also fully believe this could work well for large scale, high resolution mapping given the area is free from overhead obstructions. A more comprehensive and accurate set of ground control points would also aid in the process, but we are learning as we go and making continuous improvements.


Sunday, April 7, 2013

Field Navigation Part Four

Map navigation and an overview of techniques.


Introduction:

Over the past four weeks we have done several exercises in land navigation at The Priory in Eau Claire, Wisconsin. We began with the creation of a map for use in field navigation. We then used that map during our navigation exercises. The first field navigation exercise involved compass navigation, we extracted distance and azimuth information from the map using a compass and used that information to navigate around a portion of a predetermined course. For the second field navigation exercise we did not have the use of a map. We used handheld global positioning system (GPS) units set to Universal Transverse Mercator (UTM) zone 15N to navigate another portion of the course. The third field navigation exercise we combined the use of the map and the GPS units to navigate the entire course. During this exercise we added a little excitement by arming ourselves with paintball guns and safety equipment. During each of the navigation exercises using GPS we saved track logs so we could compare the effectiveness of our navigational abilities.

Study area:

The navigation exercises were done at the Priory and the immediate surrounding area. The Priory is located approximately 5 kilometers south of the University of Wisconsin Eau Claire (UWEC) campus on Priory Road. Directions to the Priory from UWEC are as follows. From the main campus area take Roosevelt Avenue east to State Street, turn right on State Street and follow it south until you come to Lowes Creek Road, turn right on West Lowes Creek Road, you will cross over Interstate 94 then come to Priory Road, turn right on Priory Road and watch for the sign for the Priory on your right. The terrain at the Priory consists of two levels of relatively flat ground connected with steep hills (figure 1), the lower level has deep ravines cutting through it. The Priory sits on the top level of the property, a fairly flat topped hill; the surrounding terrain drops away sharply to the north and east to the lower level. Much of the property away from the buildings and parking lots is forested, some a mix of mature hardwoods and two portions  one on the lower level and one on the south-east slope that have been planted with conifers varying in age. During the course of these exercises there were deep levels of snow present that made it difficult to maneuver around the property. Set up around this property was a course containing 18 navigation points broke into three smaller courses. These courses overlapped and intermingled with each other increasing the difficulty in navigating to the correct points for your assigned course. 
Fig.1.Looking down the steep terrain at the Priory to a classmate.
  

Methods:

Map Construction:
Map construction was done using Arcmap and Arccatalog. In Arccatalog I created a file geodatabase for navigation. After exploring the available data, I decided to keep the map fairly simple with good useable information on it. I chose a color aerial image of the area of interest (AOI) for a base map. The image shows the buildings and overall lay of the land and also shows the varying vegetation types which are very handy during the winter and early spring months when vegetation growth is limited. I also chose to include a data set of 5 meter topographic lines. These data were obtained from the United States Geological Survey (USGS), as a 1/3 arc second digital elevation model (DEM).This is not a very precise data set, at 5 meters, but it gives a general flow of the topography in the area.

In Arccatalog, using the data located within the Priory Geodatabase, I used the toolbox and the clip tool to clip the data sets using a polygon feature class that covered the navigation area and saved them to my geodatabase. I also copied the polygon feature class used to clip the data and another containing the actual property into my geodatabase.

In Arcmap I set the workspace projection to UTM Zone 15N, then had to use the project tool to project the polygons layers into UTM Zone 15N, and used the project raster tool to project the aerial image also. I layered the map with the aerial image on the bottom then the topographic lines over that. I included the search area, layered over the others, as a guide to limit our coverage during our navigation. Both the search area and the topographic layers were given bright colors to stand out against the background of the map. To aid in the navigation process I added a grid over all other areas. The grid is also set to UTM Zone 15N. The grid was added by going to the properties of the data frame then selecting grids. Select add new grid and finish the process. After the grid was been added I went back to the grid properties and adjusted the format to show lines at 20 meter intervals, label the edges so they were all readable when the map was held upright, and adjust the labels to only show the labels we wanted, the others were reduced font and given a light color. I finished by adding several map elements including: a scale, a simple legend, and a north arrow. I then adjusted the map format to create a map that would be easier to use in the field (figure 2).

Fig.2.Navigation map created for use during field navigation exercises.

During the navigation exercises at the Priory each group was given a list of coordinates to points located in the area surrounding the Priory. At each of these points there was a numbered flag with a related paper punch denoting that flag and location a total of 18 points for the full navigation course. During compass and GPS navigation the course was broken up to produce three individual navigation courses consisting of six locations each. As a class we had six groups of three people each. With only three courses, three of the groups would navigate the courses beginning to end while the other three groups would navigate the courses from the end to the beginning.  We would not know the location of the points during compass and GPS navigation.

Compass Navigation:
The first of the navigation exercises was by compass. Our map had a UTM grid in place and we were provided with both Latitude and Longitude and UTM coordinates of the points we were to locate on the first portion of the course, we would navigate them in reverse order. To place the points on the map we used the map grid with its labeled x-y coordinates, our grid was set at 20 meter intervals so there was some interpolation to gain the most accurate position on the map. At each of the six points we marked the point with a permanent marker, helping keep the marks visible during inclement weather, and labeled them.
Now that we had our points plotted we used our compass to extract the distance and azimuth data from point to point. The compass we used was my Brunton type 7. This compass allows you to utilize the grid on the map to set the compass to north after which you can simply read the azimuth bearing. Ok, it is a bit more involved than that.

To gather the azimuth bearings from the map we begin by placing the long edge of the compass baseplate on the map using it to connect one navigation point to another one pair at a time, in our case we began by connecting point one with point six. We had to be sure the direction of travel arrow always pointed in the direction we wanted to move, our point order was 1-6-5-4-3-2-1. Failure to do this could result in traveling the opposite direction we wanted. After lining up two of the points we turn our attention to the housing of the compass. The housing contains the actual needle and a series of parallel lines (orientating lines) in the bottom of the housing. In the North side of the compass housing there are also marks used to adjust for magnetic declination. In the Eau Claire area we have already determined the declination to be approximately 58 minutes west which is minimal enough that for the scale of this exercise we did not worry about it. We turned the housing until the orientating lines ran parallel to the north/south UTM lines on the map. This was also critical; the orientation lines are bicolor black and red, red faces north and black faces south. The housing must have the red portion of the lines and the north arrow facing north on the map failure to do this could again lead to navigating in the wrong direction. After we lined up the edge of the compass between two points on the map and adjusted the housing to point north we were able to read our azimuth bearing. The numbers that run around the dial are azimuth. Located under the dial at the direction of travel arrow is an index mark, the number immediately over this mark is the azimuth for our direction of travel from point to point. W e repeated this process for each of the pairs of points on the map. Two of the sets of points were longer than the compass so we used straight edge from point to point and held the edge of the compass along it (figure 3). To get the distances between each of the points we used the scale on the map and measured the distance from point to point.

Fig.3.Using the lines on a sheet of notebook paper to simulate the grid lines
on a map. We can use a compass to extract distance and azimuth data from
the map

To navigate in the field using this information the three members of our group volunteered to each do a job navigating, the jobs were using the compass to determine our bearing (Stacy), pace the distance from point to point (Andrew)and to assist in determining the direction of travel (Amy). This worked well because we each had strong points. Andrew and Amy’s pace counts were very specific and did not very over several trials, and I had previous experience using a compass to navigate. To navigate from point to point we began using the compass to determine the direction of travel. I stood at point one and rotated the housing of the compass until our bearing for the pair of points was at the index mark on the compass housing. Then, holding the compass out in front of me with the direction of travel arrow pointed away from me, turned my body and the compass as one until the red portion of the arrow (north) was within the orienting arrow, also red, inside the housing. An easy way to remember this is “red in the shed”. Once we achieved this we can look across the compass in our direction of travel. Just as when we were using the compass on the map we had to be sure the compass pointed in the direction of travel and that the red portion and north faced north or we would not be navigating in the correct direction. After we got our bearing Amy would walk out in that direction as far as she was able to while maintain a clear line of site with me. When she got as far as she could go I would communicate with her verbally if she was close enough or using hand signals to get her as precisely in line as we were able. Then using the distance measured on the map and dividing it by 100 meters then multiplying it by Andrews pace count we could determine the approximate number of paces to the next point. Andrew would pace to Amy and we would repeat this process until we were at or in the vicinity of the point we were looking for.    

GPS Navigation:
The second field navigation exercise was done using handheld GPS units. We were given a list of point locations in UTM NAD 83, our GPS units were also set at UTM. For this exercise we were to navigate the second portion of the course in the reverse order.

We began by starting a track log on the GPS to record our movements throughout the exercise. In order to locate a point we first checked the point coordinates of the point we wanted to navigate to, then we observed our coordinates on the GPS unit. Now the tricky part, we first had to get ourselves moving in the correct direction. In order to figure this out we had to ‘wander around’ a bit and figure out which way was which and get our bearings in relation to the point we wanted to navigate to. After we had a general idea of which direction we wanted to travel in we began to walk in that general direction, while walking we had to continue to watch our location on the GPS to be sure that we continued in the correct direction, adjusting our travel according to the easting and northing on the GPS.  After we located a point we would repeat this process for each consecutive point until we finished the six point course. At the conclusion of the course we stopped the track log (figure 4).

Fig.4.This map shows my individual track log during the GPS navigation
exercise. Of note is the excess travel between points.


Map Navigation:
The third and final field navigation exercise was to use our map to find all of the points in the course.  To increase the difficulty with navigating the points we armed ourselves with paintball equipment and set a challenge to see who could finish the course the fastest and gather all of the points on the course. Unlike the compass and GPS exercises we were given the point locations to add to our navigation map. Now we could see on the map where we were going and how far it was to get there along with all the relevant information the map already carried. We used a handheld GPS to create a tracklog of our progress and to collect waypoints at each of the navigation points on the course (figure 5).

Fig.5. this is a map showing my individual tracklog and waypoints
during the map navigation exercise. During the exercise my group
missed one of the points and my GPS did not record one of the
waypoints we stopped at.  

At the Priory we were greeted with several more inches of new snow. We were given the use of snowshoes which greatly aided our ability to maneuver around the property. Each member of the class was also given a nitrogen powered paintball gun and safety mask (figure 6). Due to the use of paintball equipment (figure 7) we had an established out of bounds area surrounding the Priory buildings and parking lot, included in this area is a home just to the east of the Priory, the area near the highway and the septic ponds. There were three navigation points that were located in the out of bounds area, which left a total of 15 points to locate. My team examined the map and quickly decided on a route to all of the points that appeared to be not only the shortest route but just as important did not force us to work up and down the hills. Each group had their own plan and we went to work.

Fig.6. Preparation of the paintball equipment
before the map navigation exercise.

 Fig.7.Paintball guns fire these small round projectiles filled with a colored
substance, the balls burst on impact.

During the exercise we made good time, our trail selection was good. We encountered one group that was working together; they outnumbered us two to one. Most of the trail we walked flowed well with little hostile activity. However, there was one bottleneck were we encountered four of the five other teams nearly simultaneously (figure 8). This was near point 5b and the sewer ponds, 5b sits on the side of a steep hill and the ponds, just a short distance away, are out of bounds. Using the map to navigate we were able to observe the terrain and vegetation and walk nearly strait to each of the points. At the pinch point we missed one of the navigation points. Do to the activity level at that time we did not double check our map and did not realize until we were out of the area that we had missed a point. By the time we realized our mistake it was too far to backtrack to get the missing point so we finished the course. Our group was the first to return from the field and we only missed one of the navigation points, even though we missed one point this was a successful exercise.       

Fig.8. Our group navigation track logs and waypoints from the map
navigation exercise. There is a steep hill to the north and east of the
Priory buildings, between this hill and the ponds to the north there
is a bottleneck where five of the six teams came together.

Discussion:

The creation of a good map was an essential part of these exercises. Having good information without having to much is a great advantage, too much information will make the map confusing and difficult to read. It is also essential that you are aware of where you are mapping and what the map will be used for so you can use the correct projections. We encountered an issue when using our map to do compass navigation. Our map for this exercise should have been in a geographic coordinate system but we were in UTM coordinates. We were able to use the map because we were in a fairly small area but a larger area may have created some difficulties due to our map not pointing to magnetic north.

During compass navigation we were able to navigate to only three of the six points on the course. The process was very involved up front to gather the distance and azimuth information from the map. There were also difficulties in dealing with the terrain, the steep hills and the thick vegetation caused us to have to make repeated measures which again slowed down the process and may have added to error.  In the end we only navigated to three points in three hours.

Using the GPS to navigate we were successful at navigating the entire six point course in about two hours; this is extremely fast compared to using the compass. However, the compass took us in straight lines to our points and with the GPS we were wandering around a lot (figure 9), this is a lot of wasted time. It was also difficult to keep our direction or bearing constant due to the distance you had to cover while waiting for the GPS to update your position, this may have been affected by the overhead vegetation and the several inches of fresh show that was clinging to all of that vegetation. With those difficulties there were high points. We were not forced to walk through thick brush to continue a perfectly straight line as with the compass. We were also not impeded with the hills or large trees in the way. Overall the GPS was not as precise but was much faster.
During the map navigation exercise we were not dealing with issues like extracting information from the map to use with the compass or adjusting our travel to the GPS coordinates. Instead we relied on our map information and our own eyes and our ability to interpret our surroundings. We were able to set a course that suited us instead of being directed (figure 10). The result of these was our ability to navigate to 14 of 15 points in about 2 hours. This is a great improvement over both previous methods. This time could have been shorter also if we were not in a paintball battle with five other teams. I actually considered not taking paintball guns with us just to make us lighter and faster. Although this was fast in most instances accuracy is more important than speed.

Fig.9. Class track logs from GPS navigation. these tracks are very
indirect and appear to wander around a lot.

Fig.10. Class track logs from map navigation. Many of the tracks in this
map have a much more direct route from point to point. The basemap
has been removed from this map to improve interpretation.

Conclusion:

Each of these exercises revealed strong points and weaknesses. We have already determined the importance of a good map, but the right equipment for the situation is just as important. It is also important to take into account the possibility of technological issues and being prepared to adjust your techniques to the situation at hand. Maybe it will even be necessary to go back to more primitive methods if and when technology fails or combining techniques to ensure the accuracy of your data (figure 11). With that said the knowledge of how to use each of these methods to navigate and gather data successfully is a great asset.   

Fig.11. This map is showing the waypoints for the entire class in relation
to the navigation points. the amount of variance in the points is a good
argument to back up your data with either a second method or a more
precise instrument.